Mapping Biometric Feedback Responses to Betting Intensity Levels in App-Based Chance Games
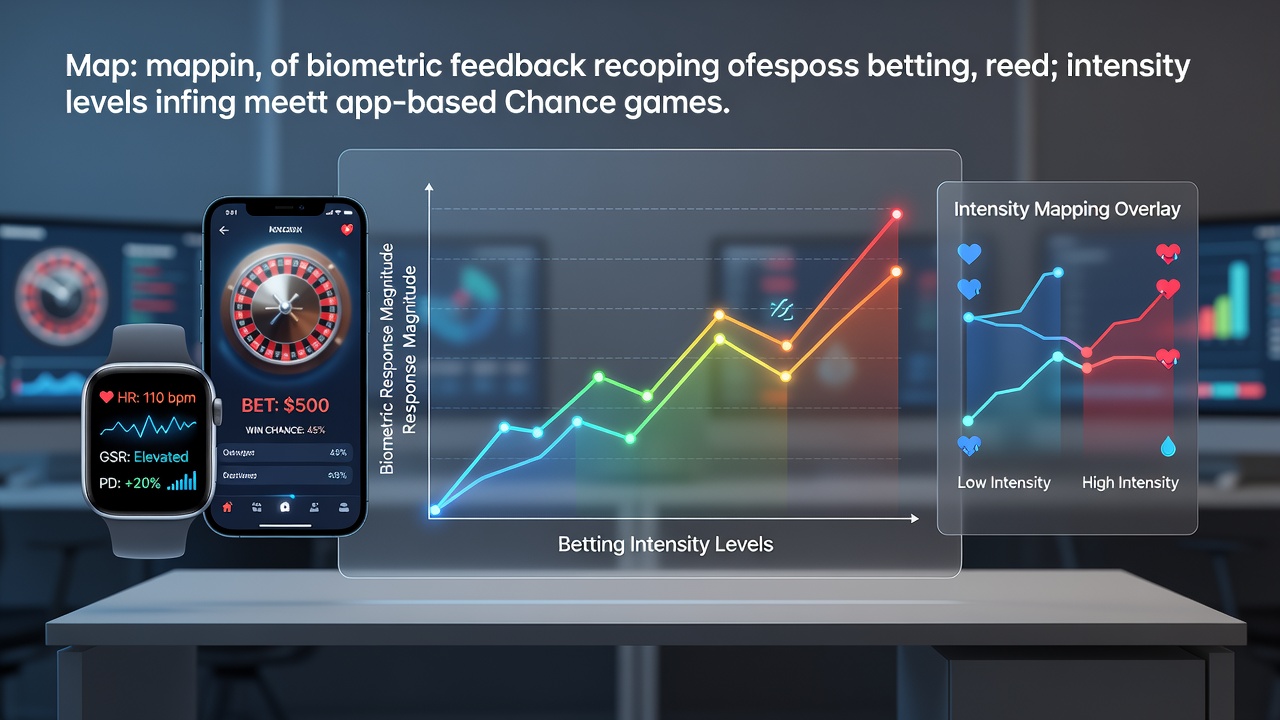
App-based chance games now incorporate biometric sensors that capture real-time physiological data, and developers map these signals directly to patterns of bet sizing and frequency across sessions. Heart rate variability, skin conductance levels, and eye-tracking metrics serve as primary indicators while players adjust wager amounts in digital environments. Studies conducted through 2026 show that elevated skin conductance often precedes increases in bet intensity, particularly during high-volatility rounds on mobile platforms.
Core Biometric Indicators Tracked in Mobile Environments
Heart rate monitors embedded in smartphones or paired wearables record fluctuations that correlate with stake adjustments, and researchers note shorter inter-beat intervals during rapid sequences of larger wagers. Galvanic skin response devices detect sweat gland activity that rises sharply when users escalate from minimum bets to mid-level stakes within the same game loop. Pupil dilation tracking through front-facing cameras provides additional data points that align with moments of decision-making around bonus features or multiplier selections.
Data collected from European mobile platforms indicates that these three metrics together predict shifts in betting intensity with measurable accuracy in controlled trials. Canadian regulatory reports further document how session logs pair biometric spikes with timestamped wager records to build individual player profiles. Such mapping allows operators to identify transitions from steady low-stake play to accelerated high-stake sequences without relying solely on self-reported behavior.
Methods for Aligning Physiological Signals With Wager Patterns
Algorithms process continuous biometric streams alongside bet logs, and they apply time-series analysis to isolate windows where physiological changes precede or follow stake modifications. One common approach segments sessions into intensity tiers based on average wager size relative to account balance, then overlays corresponding biometric readings for each tier. Machine learning models trained on aggregated datasets refine these mappings by testing correlations across thousands of user sessions collected from regulated markets.
Researchers at institutions in Australia have examined how eye movement patterns shift when players move from conservative to aggressive betting phases, and findings link sustained fixation on multiplier displays to subsequent increases in wager amounts. In parallel, North American studies integrate accelerometer data from devices to detect tension-related hand movements that accompany rapid bet raises. These layered datasets create multidimensional profiles that reveal how different biometric channels respond to varying levels of betting intensity.
Regional Data Patterns Observed Through Mid-2026
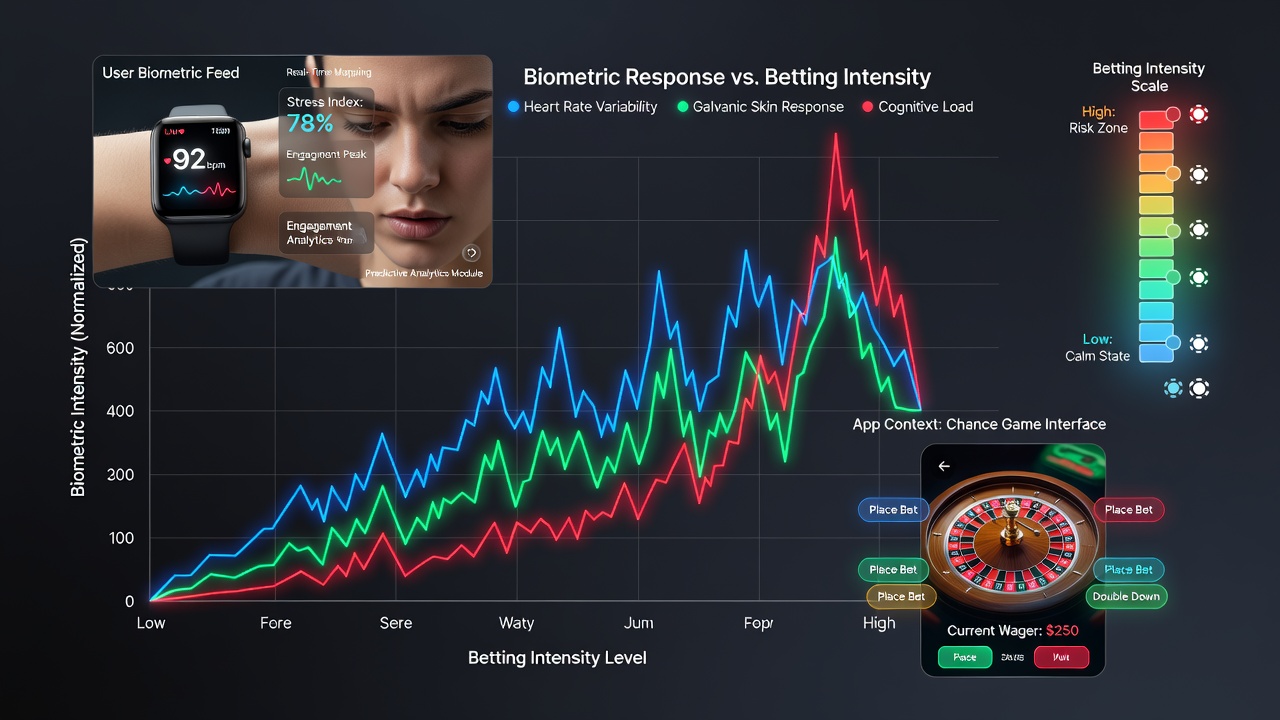
Analyses from Australian research centers reveal stronger correlations between skin conductance rises and high-intensity betting during evening hours on weekdays, while weekend patterns show more gradual escalations tied to pupil dilation changes. European datasets highlight regional variations where heart rate variability tracks more closely with bet frequency than with absolute stake size in certain jurisdictions. Reports from the Canadian Centre on Substance Use and Addiction note that cross-platform comparisons demonstrate consistent biometric signatures for intensity spikes regardless of game theme or visual design.
By June 2026 ongoing trials in multiple markets had expanded sample sizes to include diverse age groups and device types, and preliminary figures indicate improved model precision when combining at least two biometric channels. These efforts draw on partnerships between academic groups and licensed operators who supply anonymized session data under strict privacy protocols. The resulting maps help clarify how physiological responses scale across low, medium, and high betting intensity categories without assuming uniform user reactions.
Integration With Platform Features and Regulatory Frameworks
Some applications now feed mapped biometric data into real-time session management tools that adjust available stake options based on detected intensity thresholds. Regulators in Australia and Canada require operators to maintain records of such integrations to support responsible gambling measures, and industry associations publish technical guidelines for secure data handling. Academic papers indexed in public repositories, such as those accessible through NIH research archives, detail validation methods used to confirm alignment between signals and wager logs.
Additional work from the Australian Institute of Family Studies examines how these mappings differ across device operating systems and sensor qualities. Observers note that standardized reporting formats emerging in 2026 facilitate comparisons between markets while preserving user anonymity through aggregated outputs.
Conclusion
Mapping biometric feedback to betting intensity levels continues to evolve through combined physiological monitoring and session analytics in app-based chance games. Datasets gathered across continents demonstrate repeatable associations between specific signals and wager adjustments, supported by ongoing research collaborations. Regulatory frameworks in multiple regions guide the ethical application of these techniques while technical standards advance to improve measurement reliability. Continued collection of longitudinal data through 2026 and beyond will further refine the precision of these mappings across varied player populations and device ecosystems.