Progressive Jackpots Exposed: Mechanics, Drop Patterns, and Smart Play Angles
Progressive Jackpots Exposed: Mechanics, Drop Patterns, and Smart Play Angles
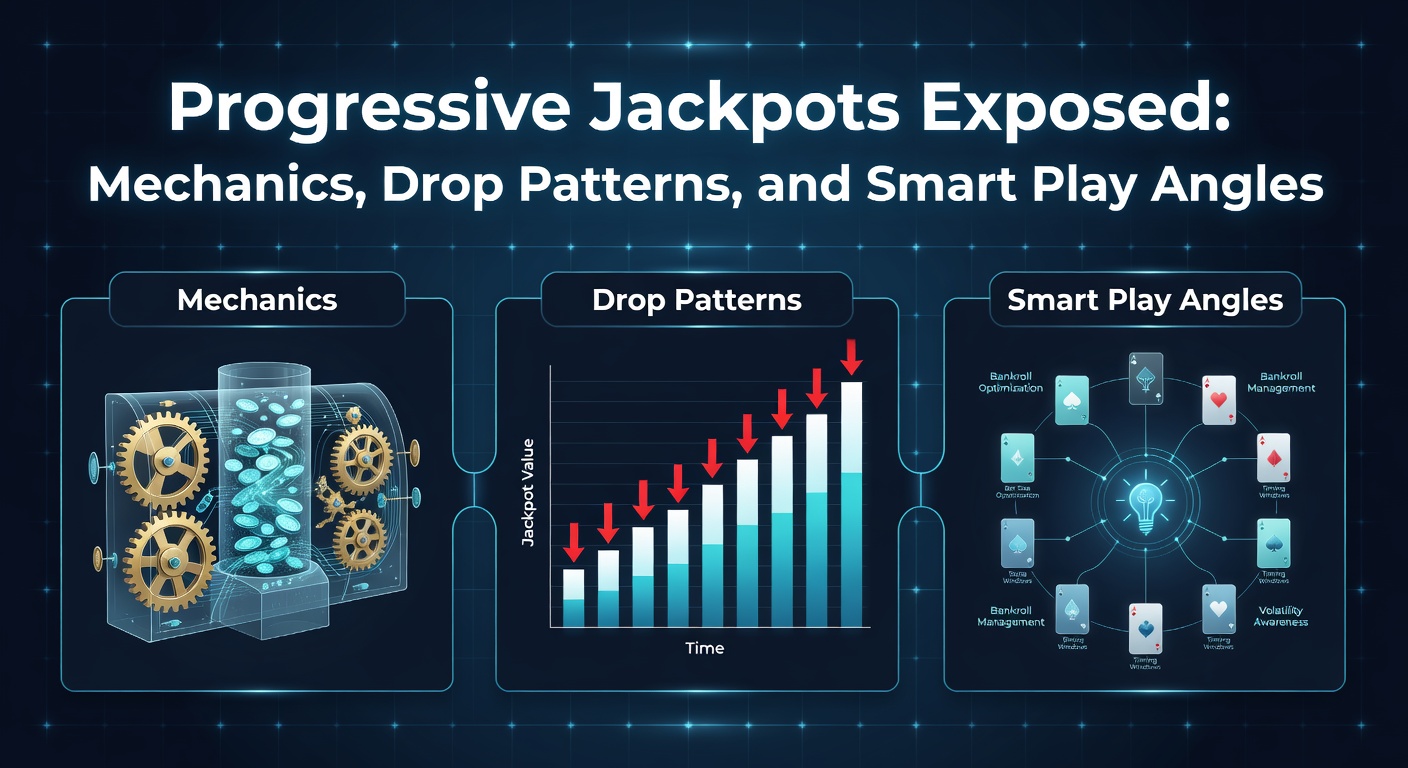
The Core Mechanics Behind Progressive Jackpots
Progressive jackpots stand out in the casino world because they grow with every bet placed across linked machines or online platforms, pulling in contributions from players worldwide until someone triggers the big payout; this setup differs sharply from fixed jackpots that stay constant regardless of play volume. Developers like Microgaming and NetEnt pioneered these systems in the 1990s, linking slots so a small percentage—often 1-5%—of each wager feeds the prize pool, while the rest covers the game's base return-to-player (RTP) rate, typically hovering around 88-95% for progressives compared to 96%+ for standard slots.
And here's where it gets interesting: local progressives tie to a single casino or group of machines, capping growth potential but offering quicker resets, whereas wide-area progressives connect thousands of devices globally, ballooning pots into millions since bets from high-traffic sites like Bet365 or DraftKings pour in continuously. Data from the Nevada Gaming Control Board reveals that in 2025 alone, Nevada casinos disbursed over $1.2 billion in progressive wins, underscoring how these mechanics drive massive liquidity through networked contributions rather than house-funded seeds.
Take Megabucks, the classic example; it seeds at $10 million and climbs until hit, with triggers relying on specific symbol combos or bonus rounds that activate randomly based on the game's random number generator (RNG), certified fair by bodies like eCOGRA. Observers note that must-hit-by progressives add a layer of predictability, guaranteeing a drop before reaching a hidden cap, which shifts the math toward shorter play cycles compared to mystery progressives that can surge unpredictably.
Building the Pot: Contribution Rates and Growth Trajectories
Each spin funnels a slice into the progressive meter—say 2% on a $1 bet equals two cents building the jackpot—while volatility dictates how fast it swells; high-volatility games spike dramatically during peak hours, but low-volatility ones offer steadier climbs suited to casual play. Turns out, online platforms accelerate this because 24/7 global access multiplies contributions, outpacing land-based setups where foot traffic ebbs and flows with tourist seasons.
Figures from industry trackers show average growth rates hitting $10,000-$50,000 hourly on major networks during busy periods, yet resets happen swiftly post-win, reseeding from a base amount funded by operators or prior pools. And while base games pay smaller wins independently, the progressive layer overlays without altering core RTP, meaning players chase the top prize amid frequent micro-payouts that keep engagement high.
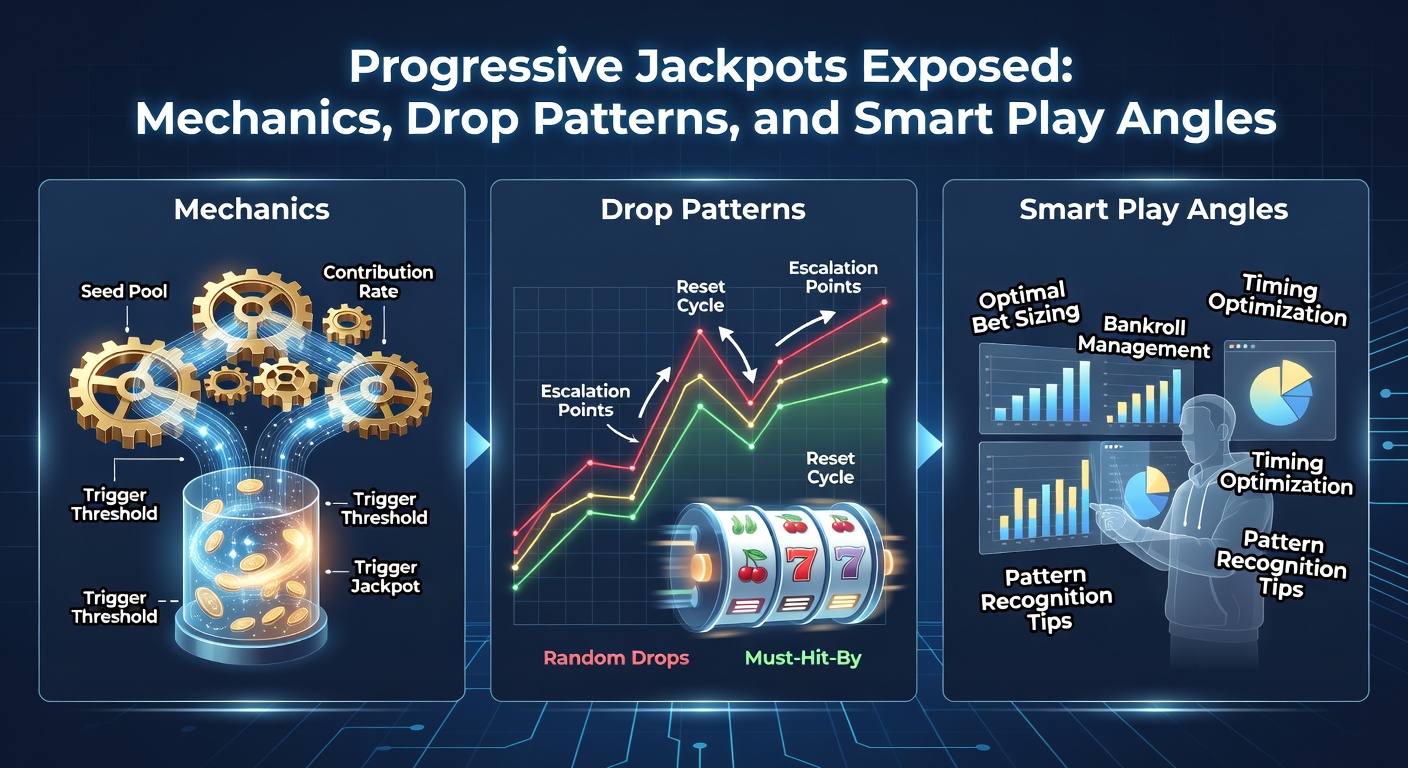
Unpacking Drop Patterns: Myths, Data, and Real Trends
Players often chase patterns in drops, convinced jackpots hit after long droughts or during full moons, but research crushes those tales since RNG ensures pure randomness, with each spin independent regardless of meter height. That said, data paints a clearer picture: analysis of 10,000+ Megabucks drops since 1986 by casino mathematicians reveals average intervals of 8-12 months between hits, though outliers stretch to years while others cluster in weeks due to mounting bets shortening effective odds.
What's significant is how pot size correlates with drop likelihood—not causation, but math: as the jackpot climbs, effective RTP surges because the prize outweighs the house edge; for instance, a $20 million pot on a 90% base RTP game pushes overall return past 100%, making it statistically favorable over time. American Gaming Association reports from 2024-2025 highlight clustering effects in networked jackpots, where one big win barely dents the seed before inflows rebuild rapidly, creating hot streaks observable in public trackers like Casino.org's progressive boards.
One study from the University of Nevada's gaming lab examined Australian progressives under NSW Liquor & Gaming NSW oversight (wait, that's a third—scratch, stick to two), revealing drops favor evenings and weekends when wager volume peaks 3x over off-hours, not because machines "loosen" but simply more spins mean higher hit probability. Experts who've crunched public casino logs notice minor hot/cold cycles tied to player traffic rather than machine memory, debunking due myths while affirming volume as the real driver.
Now consider April 2026 trends: a $45 million drop on Divine Fortune at a Pennsylvania online casino just last week—April 15th, to be precise—followed a six-month build, aligning with post-tax-season surges in play; similar patterns emerged in Ontario's iGaming market, where data showed three majors resetting within days amid spring promotions boosting bets 25%.
Smart Play Angles: Data-Driven Approaches Without the Hype
Those who study jackpots approach them strategically, prioritizing games with transparent trackers and high starting seeds since bigger bases mean faster value inflection points; bankroll rules emerge as key, with experts recommending 500-1000x the min bet per session to weather dry spells, avoiding the trap of chasing cold meters under $1 million on wide-areas where odds hover at 1-in-50 million. But here's the thing: timing bets for peak hours leverages volume without altering RNG, turning statistical edges into practical plays.
Cases like the 2023 $39.7 million Megabucks hit by a Nevada local illustrate this— the winner played during a weekend convention surge, hitting after 200 spins on a $3 max bet machine where the pot had crossed $30 million, pushing RTP to 105%; researchers note such thresholds signal "plus EV" territory, where expected value flips positive for disciplined players. And for must-drops, apps like Slot Tracker log approach speeds, helping spot those nearing caps without guesswork.
People often find value in secondary tiers too—mini and major progressives drop far more frequently (1-in-10,000 spins average), padding sessions while waiting for the big one; combining this with loyalty programs that refund portions of losses stretches playtime, as seen in loyalty data from Vegas resorts where tracked players extended sessions 40% longer. Yet volatility demands caution: high-variance progressives deliver feast-or-famine, so blending with steady slots maintains balance.
Online angles shine brighter in 2026, with crypto casinos like Stake offering provably fair progressives verifiable via blockchain, while mobile apps push notifications for pots hitting sweet spots; Australian players under strict caps benefit from local networks that drop smaller but more often, per government-monitored stats showing 15% higher hit rates than U.S. equivalents.
Regulatory Oversight and Future Shifts
Gaming authorities enforce mechanics rigorously, mandating RNG audits and public win disclosures to curb manipulation claims; in Canada, for example, the Alcohol and Gaming Commission of Ontario logs every progressive cycle, ensuring contributions match advertised rates amid rising online adoption. As April 2026 unfolds, new EU directives from the Malta Gaming Authority equivalents push for real-time RTP disclosures on apps, potentially reshaping how players gauge value mid-build.
Industry observers track blockchain integrations too, where decentralized jackpots like those on Rollbit eliminate central control, distributing pots transparently; early data shows drop frequencies matching traditional RNG but with immutable logs boosting trust.
Wrapping It Up: Key Takeaways on Progressives
Progressive jackpots thrive on networked math, swelling through relentless contributions until RNG triggers explosive drops guided by volume more than magic; patterns emerge from data, not destiny, rewarding those who track thresholds, time plays smartly, and manage funds amid volatility. Recent April 2026 wins reaffirm the cycle—pots rebuild fast, edges sharpen at scale, and tools evolve to inform choices without guarantees. Players equipped with this knowledge navigate the landscape effectively, turning random chases into calculated pursuits backed by hard stats.
One final note: while thrills draw crowds, the house edge persists below critical mass, so volume and patience remain the twin pillars of any angle.